UICharts
I needed some charts and graphs for Eonblade to visualize player data, but most off-the-shelf graphing solutions for Unreal cost upwards of $200, and don't look robust enough for my taste. So, I decided to just write a small widget library to handle data visualization and make it available for everyone. It's still a work in progress, but what I have so far satisfies most of our needs.
Source code available on GitHub
Showcase
Radar Chart:
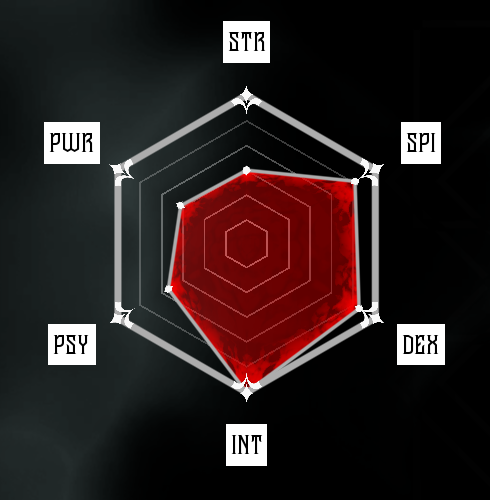
The first UV channel is projected